OS X Crash Report Symbolication
As you may know I write a small OS X called Sail. Over the past few months that it has been available I've received a few crash reports about an issue I wasn't able to reproduce. Today I decided I wanted to dive into them and see if I could at least figure out the root of the issue and fix it with my next release.
This lead me down the rabbit hole of symbolication, something I personally hadn't dealt with myself before (since Crashlytics does it for you). I was hoping I would be able to find something around the internet about this, unfortunately what I mostly came up with was a lot of iOS related answers that didn't seem to work the same way and two links to Apple documentation that have been removed. Other than the process for symbolicating reports for OS X apps seems to be different than iOS apps which there is plenty of documentation for (I'm not bitter). Daniel Jalkut has a post about these but his exact method didn't seem to work for me.
Here is what did work for me. For my first abridged crash report I had this
Process:         Sail [35072]
Path:            /Applications/Sail.app/Contents/MacOS/Sail
Load Address:    0x106823000
Identifier:      com.keithsmiley.SailOSX
Version:         4 (1.2.0)
Code Type:       x86_64 (Native)
Parent Process:  launchd [207]

Date/Time:       2013-07-19 16:09:24.097 +0200
OS Version:      Mac OS X 10.8.4 (12E55)
Report Version:  8

Thread 0:
13  Accounts                        0x00007fff839fd1b1 -[ACAccountStore accountTypeWithAccountTypeIdentifier:] + 230
14  Sail                            0x00000001068308f7
15  Sail                            0x0000000106830798
16  Sail                            0x0000000106825249
17  CoreFoundation                  0x00007fff82465eda _CFXNotificationPost + 2554
18  Foundation                      0x00007fff8611b7b6 -[NSNotificationCenter postNotificationName:object:userInfo:] + 64
31  AppKit                          0x00007fff812cc1a3 -[NSApplication run] + 517
32  AppKit                          0x00007fff81270bd6 NSApplicationMain + 869
33  libdyld.dylib                   0x00007fff869d07e1 start + 0

Binary Images:
  0x106823000 - 0x106896fff  com.keithsmiley.SailOSX (1.2.0 - 4) <D1F313B6-21F6-341B-8627-5480C5D1DB20> /Applications/Sail.app/Contents/MacOS/Sail
Just glancing at this crash report it's not too difficult to understand a bit
about what was going on. A notification was sent, some methods were called in my
application and then accountTypeWithAccountTypeIdentifier was called. Based on
the small number of times I call that method I was quickly able to assume where
the issue was but I still wanted to see exactly what methods of mine were being
called first.
This brings me to atos the command line tool Apple provides to symbolicate
these reports. This is where my experience differs with most of what I found
online. My usage looked like this:
atos -arch x86_64 -o Sail.app.dSYM/Contents/Resources/DWARF/Sail -l 0x106823000
This uses my dSYM file that was generated with the archive build I submitted to the app store along with the knowledge that it was running on an x86_64 architecture and the most important part, for me, the load address.
To find my dSYM file that was generated when I did my archive build I simply
noted the version and build number from the crash report, went to the Archives
tab in the Xcode organizer, found the build with the same number, right clicked
and clicked "Show in Finder." This takes you directly to the .xcarchive file
on disk which you can right click and click "Show Package Contents." From there
I copied my dSYM to the desktop so I didn't overwrite anything unintentionally.
The load address is the starting memory address of your application. The tool
uses this address as an offset to find the correct methods in your symbols. In
the above crash report Load Address is a provided field. This was the only
report I saw that had that, typically I needed to look under the Binary Images
section for the address range of my application. In this example it was
0x106823000 - 0x106896fff.
The atos command then provides an interactive prompt where you can paste
addresses into the stdin and it will tell you the corresponding methods. Mine
looked like this:
0x00000001068308f7
-[KSAccountsPreferences dealloc] (in Sail) (KSAccountsPreferences.m:77)
0x0000000106830798
-[KSAccountsPreferences viewDidLoad] (in Sail) (KSAccountsPreferences.m:73)
0x0000000106825249
-[KSAppDelegate openAboutWindow:] (in Sail) (KSAppDelegate.m:59)
Here I can see that the notification that was being posted was probably an
NSApplicationDidFinishLaunchingNotification starting off some methods in my
app delegate. I then load the accounts preferences, which would make sense to
call the ACAccountStore method, but then dealloc is called. Seeing this was
an immediate red flag since KSAccountsPreferences should be retained since it
provides information about available accounts to the rest of the application.
I had another crash report from a different issue that was a little bit harder to parse without symbolicating the methods.
Process:         Sail [47027]
Identifier:      com.keithsmiley.SailOSX
Version:         1.2.0 (4)
Code Type:       X86-64 (Native)
Parent Process:  launchd [45696]
User ID:         502

Application Specific Information:
*** Terminating app due to uncaught exception 'NSRangeException', reason: '*** -[__NSArrayM objectAtIndex:]: index 0 beyond bounds for empty array'
abort() called
terminate called throwing an exception

Application Specific Backtrace 1:
2   CoreFoundation                      0x000000010c5008ec -[__NSArrayM objectAtIndex:] + 252
3   Sail                                0x000000010b838eed Sail + 61165
4   Sail                                0x000000010b838f36 Sail + 61238
5   Sail                                0x000000010b838b19 Sail + 60185
6   Sail                                0x000000010b83785d Sail + 55389
7   libdispatch.dylib                   0x000000010fa07f01 _dispatch_call_block_and_release + 15

Binary Images:
  0x10b82a000 - 0x10b89dff7 +com.keithsmiley.SailOSX (1.2.0 - 4) <47EC2733-B543-31EA-A6AA-9D998FB65803>
Obviously this was caused by an invalid access to an array but that's a little harder to track down. So I again used atos with the dSYM and new memory location.
atos -arch x86_64 -o Sail.app.dSYM/Contents/Resources/DWARF/Sail -l 0x10b82a000
I got this output for my memory addresses
0x000000010b838eed
-[KSAccountsPreferences selectedADNUser] (in Sail) (KSAccountsPreferences.m:238)
0x000000010b838f36
-[KSAccountsPreferences selectTwitterUsername] (in Sail) (KSAccountsPreferences.m:243)
0x000000010b838b19
-[KSAccountsPreferences populateTwitterAccounts] (in Sail) (KSAccountsPreferences.m:211)
0x000000010b83785d
__36-[KSAccountsPreferences viewDidLoad]_block_invoke (in Sail) (KSAccountsPreferences.m:70)
This ended up giving me the exact line where out of bounds issue was happening
depending on a certain number of accounts. I noticed that this issue had been
fixed since my last release so I did a diff on the tag I created for that
specific release with
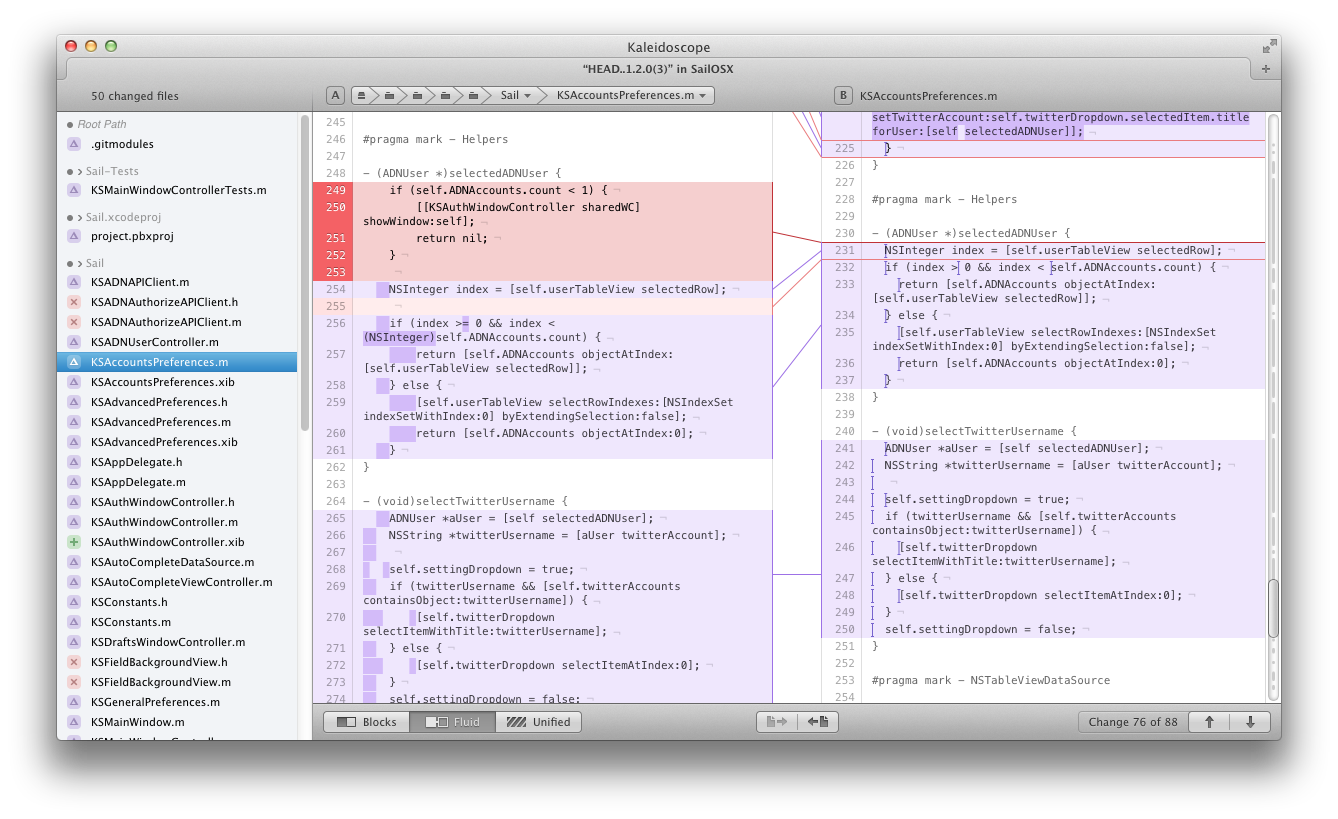
git difftool HEAD..1.2.0\(3\)
Then in Kaleidoscope I was able to figure out what changed had fixed the issue. Just because it's so pretty here is what it looked like.
Symbolicating crash reports is definitely vital to tracking down bugs your users are experiencing when you can't reproduce them yourself. Once you figure out how it's obviously worth it.